Awareness Survey of 18-Year-Olds – National Election Results of 41st installment announced
The 41st installment of the Awareness Survey of 18-Year-Olds, launched by The Nippon Foundation in October 2018, was carried out from August 12 to 16 on the subject of the “National Election.” With the current term of the Lower House of Japan’s Diet (parliament) set to end in October, an election will be held by sometime in November at the latest. The survey therefore covered 916 young persons between the ages of 17 and 19 who will have turned 18, the legal voting age, by October 31. The survey found that 55% of respondents intend to vote in the election, which is significantly higher than the 40% of 18- and 19-year-olds who voted in the previous Lower House election in 2017. Among the 22% of respondents who replied that they will not vote or probably will not vote, the top reason given for not voting was that it is burdensome, followed by their being busy, and a feeling that their vote does not matter.
Issues related to health and hygiene, including coronavirus infections and vaccines, were viewed as the highest priority issue for the election by both male and female respondents, indicating heightened interest in the pandemic among this age group. Broken down by male and female respondents, women were also interested in issues related to the rights and protection of children and issues related to LGBTQ individuals, while men were interested in issues related to disaster response, education, and schools.
Among measures that respondents thought would increase their own inclination to vote, internet voting ranked highest. Television was the main source of information for politics and elections, with more than twice the number of responses compared with internet news and newspapers, showing a trend of differentiation in media use among young people.
Notes:
- From the 13th survey, the number of respondents, comprising men and women aged 17 to 19, has been increased to 1,000 from 800, but for the 41st installment was 916 respondents who will turn 18 by October 31. (With the exception of the 20th installment, “Awareness Survey of Society and Country,” all surveys cover respondents in Japan only.)
- In the information below, differences between total amounts and simple sums are due to rounding.
Survey 41. National Election (Results announced on September 30, 2021)
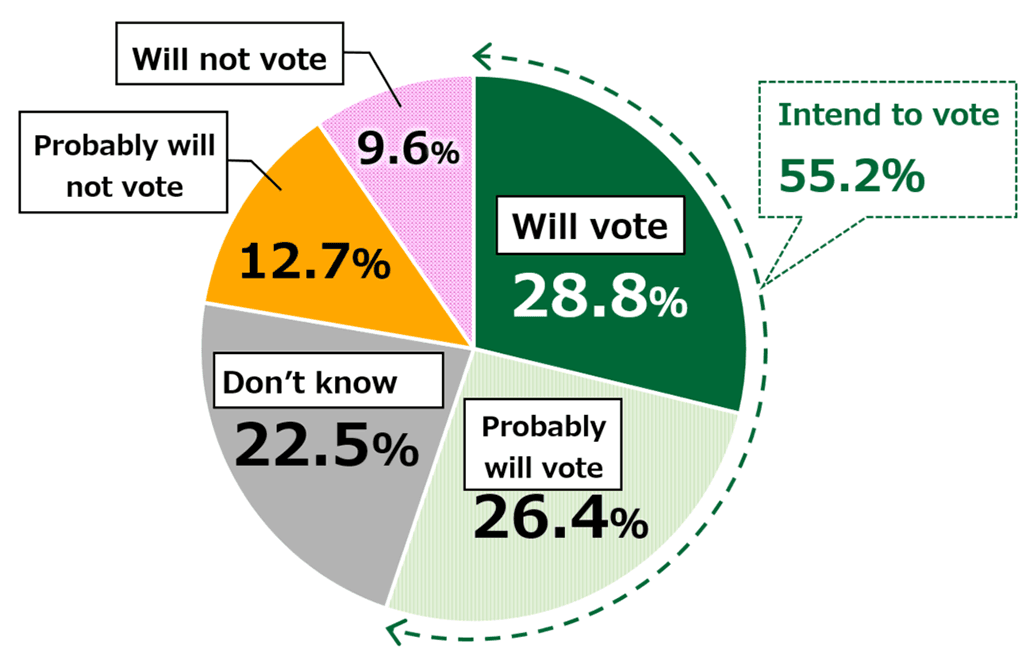
Finding: 55.2% of respondents intend to vote. (n = 916)
“Do you intend to vote in the upcoming Lower House election?”
Finding: Health and hygiene was rated the most important social issue of the election, followed by economic growth and employment, and child rearing and the declining birthrate. (average rating of each item, rated on a priority of 1 to 10; n = 916)
- Health and hygiene
(Coronavirus infections and vaccines, local health centers, etc.) - Economic growth and employment
(Unemployment rate, “black” companies, work style reforms, etc) - Child rearing and declining birthrate
(Birthrates, child care and maternity/paternity leave, nurseries, subsidies, etc.) - Disaster response and recovery
(Strengthening of nation’s resilience to earthquakes, tsunami, typhoons and floods, etc.) - Child poverty
(Gaps in education and experiences, hunger, etc.) - Education and schools
(Content, quality, teachers’ workloads, use of information technology, etc.) - Rights and protection of children
(Child abuse, child pornography, etc.) - Taxes and tax system
(Consumption tax, corporate taxes, personal income tax, etc.) - Social security and health care
(Nursing care, pensions, medical costs, etc.) - Poverty among adults and working individuals
(Working poor, social safety net, homelessness, etc.)
Finding: Being able to vote by smartphone or personal computer ranked highest among measures that would make respondents more interested in voting and likely to vote, followed by receipt of a present or gift, and greater availability of easy-to-understand information about politics and elections via the internet. (one answer per item; n = 916 per item)
“What would make you more interested in voting and likely to vote?”

Contact
Public Relations Team
The Nippon Foundation
- Email: cc@ps.nippon-foundation.or.jp
