Awareness Survey of 18-Year-Olds LaunchedThe Nippon Foundation begins long-term tracking of attitudes of new adults
In 2015, Japan lowered its voting age to 18 from 20, allowing 18- and 19-year-olds to vote for the first time in the 2016 Upper House election, and earlier this year, the Civil Code was revised to lower the age of adulthood to 18 for things like marriage without parental consent and taking out loans and credit cards, with effect from April 2022 (the legal age for smoking, drinking alcohol, and gambling is set to remain at 20).
Against this backdrop, The Nippon Foundation launched an Awareness Survey of 18-Year-Olds in October 2018 to track the attitudes and awareness of 18-year-olds regarding politics, society, work, families, friends, and other issues. Initially, the Foundation intends to carry out 12 surveys, bimonthly from October 2018 through March 2019, and then to continue after that to track the attitudes of 18-year-olds over the long term. The survey is being carried out with the assistance of online research provider Cross Marketing Inc., with 800 responses obtained from Cross Marketing’s male and female research panelists between the ages of 17 and 19 for each survey. The results of the first two surveys are summarized below.
Survey 1. Adulthood at Age 18 (Results announced October 3, 2018)
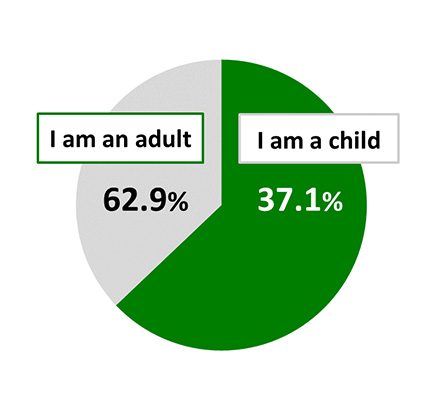
Findings: More that 60% of respondents consider themselves “children”
“I am an adult” (37.1%) vs. “I am a child” (62.9%)
Top reasons given for “I am an adult” responses
- I am no different than adults – 42.8%
- I have sufficient decision-making capabilities – 42.1%
- I have the right to vote – 31.3%
Top reasons given for “I am a child” responses
- I am not financially independent – 61.8%
- I am not legally an adult – 52.1%
- I don’t feel that I have sufficient decision-making capabilities – 36.0%
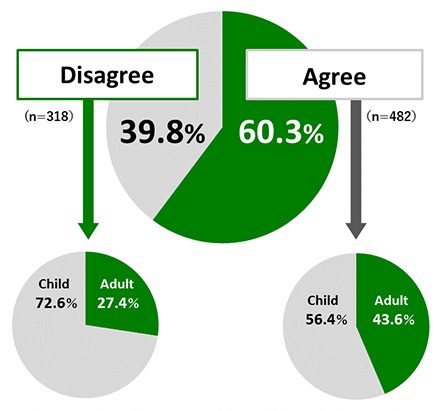
60% of respondents agree with lowering the age of adulthood to 18
“Agree” (60.3%) vs. “Disagree” (39.8%)
Of those who agree:
- Consider themselves an adult – 43.6%
- Consider themselves a child – 56.4%
Of those who disagree:
- Consider themselves an adult – 27.4%
- Consider themselves a child – 72.6%
Top reasons given by those who “Agree”
- They possess self-awareness as an adult – 29.3%
- It will instill a sense of responsibility – 28.0%
Top reasons given by those who “Disagree”
- The number of irresponsible adults will increase – 50.9%
- Many do not appear to possess self-awareness as an adult – 50.9%
Specific items with majority agreement for lowering age to 18
- Right to vote – 67.1%
- Lowering the age of application of the Juvenile Act (covering the handling of criminal acts by juveniles – currently age 20) – 66.1%
- Being eligible for a 10-year passport (currently 5 years) – 63.1%
- Being able to request a sex change (currently age 20) – 60.9%
- Being able to marry without parental consent – 55.9%
Specific items with majority agreement for not lowering age to 18
- Smoking (currently age 20, unchanged after 2022) – 77.6%
- Requirement to join national pension system (currently age 20, unchanged after 2022) – 74.3%
- Publicly administered gambling (horse racing, boat racing, etc.; currently age 20, unchanged after 2022) – 72.5%
- Drinking alcohol (currently age 20, unchanged after 2022) – 69.4%
- Pachinko, etc. (currently age 18, unchanged after 2022) – 69.3%
Survey 2. Newspapers (Results announced October 15, 2018)
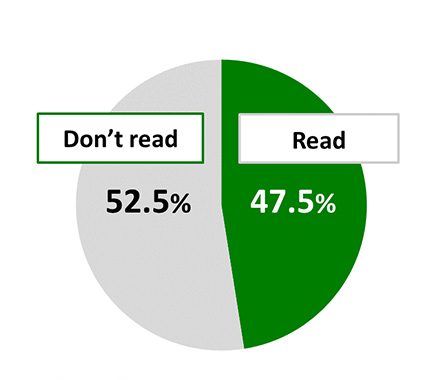
Findings: More than half of respondents do not read a newspaper
Read a newspaper (47.5%) vs. Don’t read a newspaper (52.5%)
Top reasons for not reading a newspaper
- Troublesome, insufficient time – 50.7%
- Do not subscribe / Am not in the habit – 30.7%
- Cost – 28.3%
- Other media (television, internet) are sufficient / Not necessary – 23.3%
- Areas of interest not covered – 19.0%
Main sources of information
- Television programs – 77.6%
- Social media – 39.8%
- News outlets’ internet sites – 36.4%
- Television commercials – 28.4%
- Video streaming, video sharing internet sites – 22.1%
- Newspapers – 14.8%
- Radio – 9.9%
- Blogs, other internet sites – 8.0%
- Magazines – 7.0%
- Other – 8.0%
Top reasons for media selection
- Convenience – 38.1%
- Free – 33.5%
- Habit – 31.6%
- Swift delivery of timely information – 29.5%
- Large volume of information – 29.4%
Most trusted media
- Television programs – 50.3%
- Newspapers – 37.3%
- Radio – 18.3%
- News outlets’ internet sites – 16.5%
- Television commercials – 15.6%
- Social media – 10.6%
- Video streaming, video sharing internet sites – 6.4%
- Others – 0.5%
- No trusted media – 25.6%
Contact
Communications Department
The Nippon Foundation
- E-mail:cc@ps.nippon-foundation.or.jp
