Awareness Survey of 18-Year-OldsResults of 15th and 16th installments announced
The 15th installment of the Awareness Survey of 18-Year-Olds, launched by The Nippon Foundation in October 2018, was carried out in late May and early June with a theme of “National Elections.” The results, announced on June 27, showed that roughly half of respondents of voting age planned to vote in the July 21 House of Councillors (the upper house of Japan’s national legislature) election, and of those who planned to vote, roughly 60% said they would cast their vote based on the candidates’ policies, while roughly 20% would vote based on political party.
The results of the 16th installment, on the theme of the “Tokyo 2020 Olympic and Paralympic Games,” announced on July 22, showed that close to 70% of respondents are looking forward to the Olympics, Paralympics, or both. The events in which respondents were most interested were aquatics, followed by the opening ceremony and athletics for the Olympics, and wheelchair basketball, followed by the opening ceremony and wheelchair tennis for the Paralympics.
Notes:
- From the 13th survey, the number of respondents, comprising men and women aged 17 to 19, has been increased to 1,000 from 800.
- In the information below, differences between total amounts and simple sums are due to rounding.
Survey 15. National Elections (Results announced on June 27, 2019)
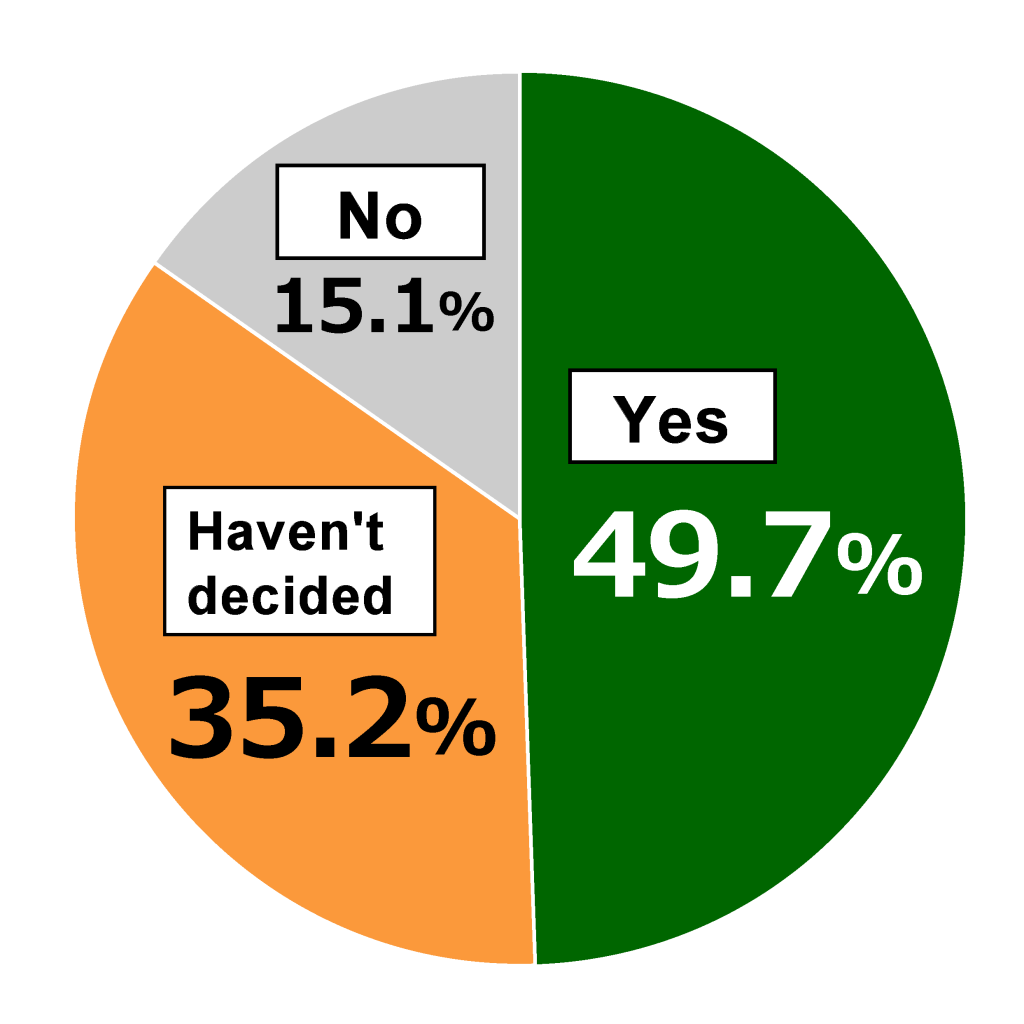
Finding: 49.7% of respondents eligible to vote (i.e. age 18 or 19 as of July 21) planned to vote in the July 21 upper house election.
“Do you plan to vote in the upcoming election?” (n=668)
- Yes (49.7%)
- Haven’t decided (35.2%)
- No (15.1%)
Of those respondents who planned to vote, the top criteria for deciding how to vote were: (n = 332)
- Candidates’ policies – 60.8%
- Political party – 19.6%
- Name recognition – 6.3%
- Recommended by friend or family member – 4.5%
- Others – 1.5%
- No particular criteria – 7.2%
Of those respondents who planned to vote, the main media for obtaining information about candidates and parties were: (n = 332)
- Official candidate rosters – 24.4%
- Candidates’ posters – 16.9%
- Election news on the internet – 13.9%
- Election news in newspapers and on television – 11.7%
- Internet (candidates’ and parties’ websites, blogs, social media, etc.) – 8.7%
- Candidates’ campaign broadcasts on television – 6.3%
Survey 16. Tokyo 2020 Olympic and Paralympic Games (Results announced on July 22, 2019)
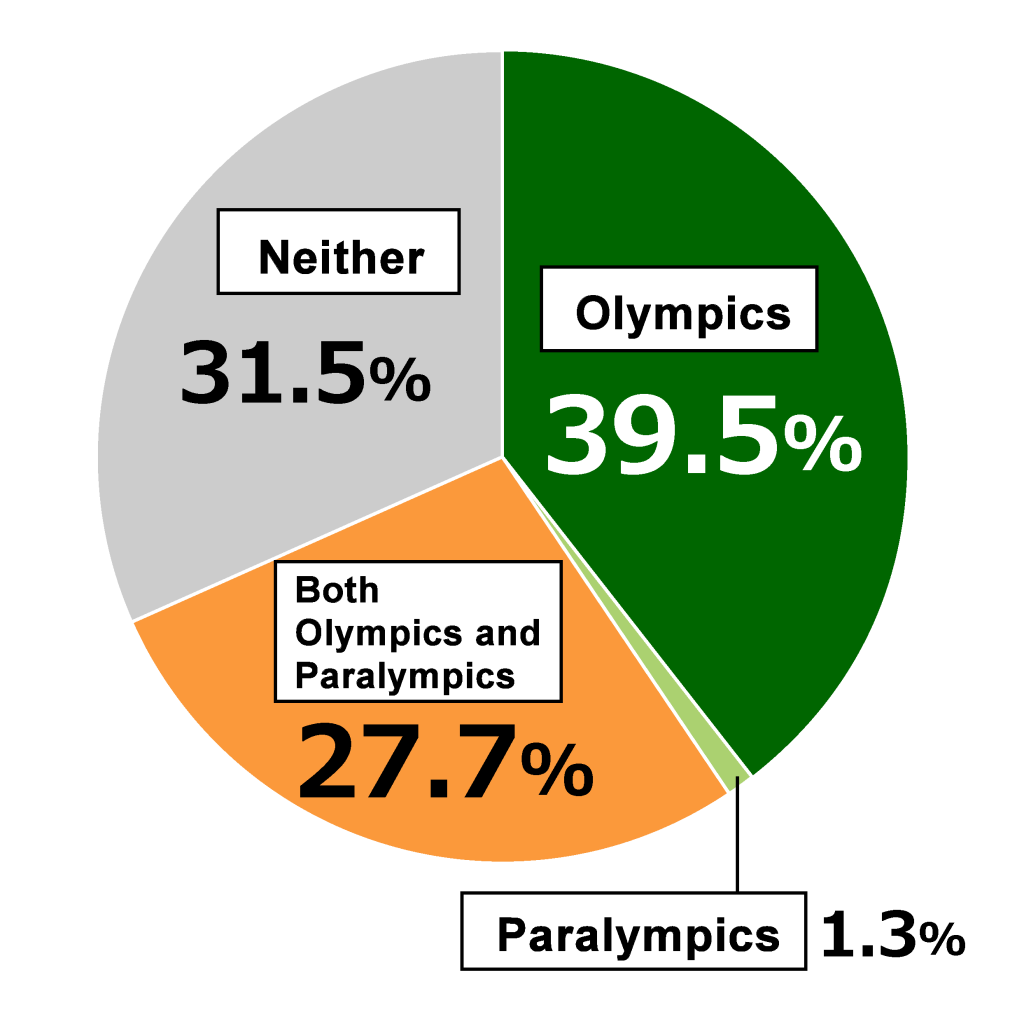
Finding: Close to 70% of respondents are looking forward to the Olympics, Paralympics, or both. (n = 1,000)
Are you looking forward to the Tokyo 2020 Olympics and/or Paralympics?
- Olympics – 39.5%
- Paralympics – 1.3%
- Both Olympics and Paralympics – 27.7%
- Neither – 31.5%
Olympic events in which respondents were most interested (Up to three answers allowed; n = 1,000)
- Aquatics (swimming, diving, etc.) – 23.7%
- Opening ceremony – 22.6%
- Athletics (track and field, etc.) – 21.9%
- Baseball/Softball – 18.5%
- Football (soccer) – 17.3%
- Volleyball – 14.3%
- Table tennis – 13.6%
- Tennis – 12.6%
- Closing ceremony – 10.7%
- Badminton – 10.6%
Paralympic events in which respondents were most interested (Up to three answers allowed; n = 1,000)
- Wheelchair basketball – 21.4%
- Opening ceremony – 19.2%
- Wheelchair tennis – 17.6%
- Athletics (track and field, etc.) – 17.5%
- Swimming – 13.1%
- Closing ceremony – 11.8%
- Badminton – 10.0%
- Football 5-a-side – 8.3%
- Table tennis – 8.1%
- Archery – 7.5%
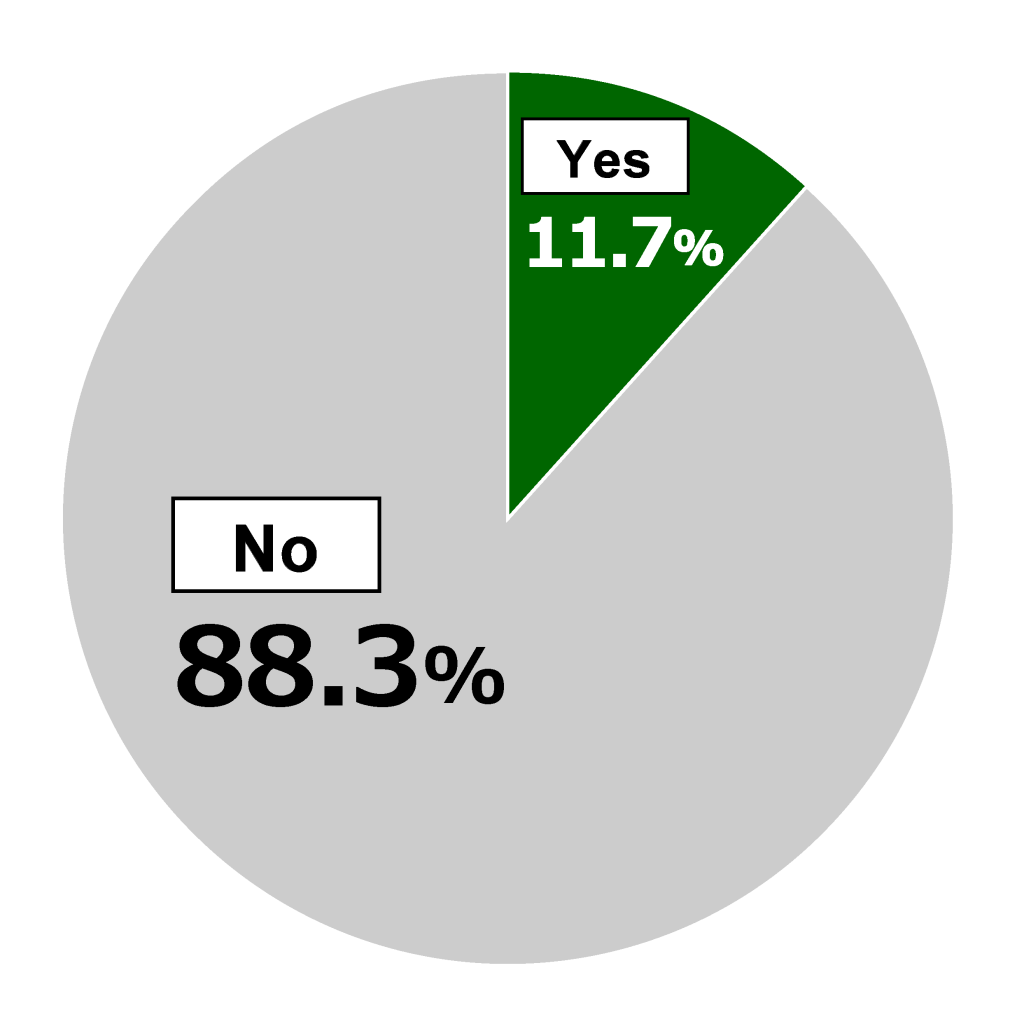
Finding: Roughly 12% of respondents knew that cultural programs were also a required part of hosting the Olympics and Paralympics. (n = 1,000)
Did you know that cultural programs were also a required part of hosting the Olympics and Paralympics?
- Yes – 11.7%
- No – 88.3%
Top areas in which respondents would like cultural programs to focus. (Up to three answers allowed; n = 1,000)
- Music – 53.2%
- Food culture – 38.3%
- Anime and manga (Japanese animation and comics) – 31.6%
- Traditional performing arts and culture – 30.9%
- Modern art – 13.8%
Top expectations for the Tokyo 2020 Olympics and Paralympics. (n = 1,000)
- Athletes competing to win medals – 28.6%
- Promoting understanding of Japan and enhancing Japan’s place in the world – 8.2%
- Promoting sports and culture – 7.3%
- International cultural exchange – 7.1%
- Realization of a society that embraces diversity – 6.3%
- Better transportation infrastructure and places to live – 5.9%
- Latest services using information technology – 5.6%
- Increase in tourism from overseas – 5.1%
- Improved understanding of persons with disabilities – 4.6%
- Others – 0.4%
- None in particular – 20.9%
Top things for which preparations need to be made. (n = 1,000)
- Summer heat – 30.4%
- Terrorism – 24.1%
- Road and public transportation congestion – 20.3%
- Earthquake – 9.1%
- Torrential rain – 3.7%
- Others – 1.2%
- None in particular – 11.2%
Contact
Public Relations Team
The Nippon Foundation
- Email: cc@ps.nippon-foundation.or.jp
