Awareness Survey of 18-Year-OldsResults of 17th and 18th installments announced
The 17th installment of the Awareness Survey of 18-Year-Olds, launched by The Nippon Foundation in October 2018, was carried out in late July on the theme of the “Consumption Tax.” Japan’s consumption tax (similar to other countries’ sales tax or value-added tax) rate rose to 10% from 8% for most items effective October 1 (with the 8% rate remaining in place for certain designated items). The results, announced on August 29, showed that more than one-fourth of respondents felt the 10% rate was appropriate or that the rate should be higher, while close to half of the respondents felt the rate should be kept at 8% or lower, and roughly 10% thought the consumption tax should be eliminated entirely.
The results of the 18th installment, on the theme of “Work,” were announced on September 17 and showed that more than half of respondents have decided on a field in which they want to work, with the top choices being civil servant, company employee, and IT-related. The survey also showed that roughly one-fourth of respondents want to work in a major city in Japan, roughly one-fourth want to work in a regional city in Japan, and slightly less than 5% want to work overseas. In addition, slightly more than half of respondents intend to give priority to their personal life over their work, and slightly more than one-third want to spend their entire career at the same company.
Notes:
- From the 13th survey, the number of respondents, comprising men and women aged 17 to 19, has been increased to 1,000 from 800.
- In the information below, differences between total amounts and simple sums are due to rounding.
Survey 17. Consumption Tax (Results announced on August 29, 2019)
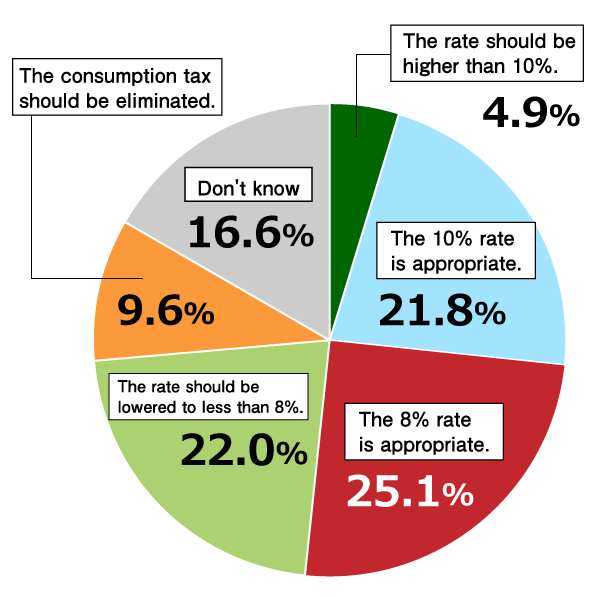
Finding: 21.8% of respondents felt the 10% consumption tax rate was appropriate, while 25.1% thought the 8% rate was appropriate. (n=1,000)
“What is your opinion regarding the October consumption tax rate increase to 10% from 8%?”
- The rate should be higher than 10%. (4.9%)
- The 10% rate is appropriate. (21.8%)
- The 8% rate is appropriate. (25.1%)
- The rate should be lowered to less than 8%. (22.0%)
- The consumption tax should be eliminated. (9.6%)
- Don’t know (16.6%)
To mitigate the effect of the tax increase on low-income households, the rate will remain unchanged at 8% for daily necessities including food and takeout dishes, non-alcoholic drinks, and certain newspaper subscriptions. Of the 362 respondents who approved of the measure, the top reasons were: (multiple answers allowed; n = 362)
- It is for daily necessities – 48.3%
- It is a measure to assist people with low incomes – 33.4%
- It will collect more tax from people who purchase luxury items – 29.3%
- It is a fair way to share the tax burden – 22.1%
- The tax increase will not affect my daily life – 15.7%
- Increasing the tax burden in stages will not harm the economy – 15.5%
- Others – 0.3%
Of the 349 respondents who did not approve of the measure, the top reasons were: (multiple answers allowed; n = 349)
- The definition of daily necessities is ambiguous – 58.7%
- It is strange that certain newspapers are included in addition to food and beverages – 40.4%
- The introduction of checkout operations and bookkeeping systems will incur costs – 36.4%
- It is insufficient as a measure to assist people with low incomes – 29.2%
- The tax should be collected at a uniform rate with a certain portion of proceeds redistributed as needed – 22.1%
- Tax revenue will decrease – 10.6%
- Others – 10.3%
Finding: The top three purposes for which respondents wanted to see the proceeds of the consumption tax used were support for children, social security, and education and scientific development. (multiple answers allowed; n = 1,000)
“For what purposes do you believe the proceeds of the consumption tax should be used?”
- Support for children – 51.0%
- Medical care, pensions, nursing care, and other forms of social security – 44.5%
- Education and scientific/technological development – 38.4%
- Disaster preparedness and recovery – 30.8%
- Economic measures – 29.0%
- Repayment of national debt – 28.7%
- Roads, housing, and other infrastructure – 21.1%
- Environmental measures – 20.5%
- Regional revitalization – 12.0%
- National defense – 10.6%
- Tourism industry – 8.9%
- Others – 2.1%
Survey 18. Work (Results announced on July 22, 2019)
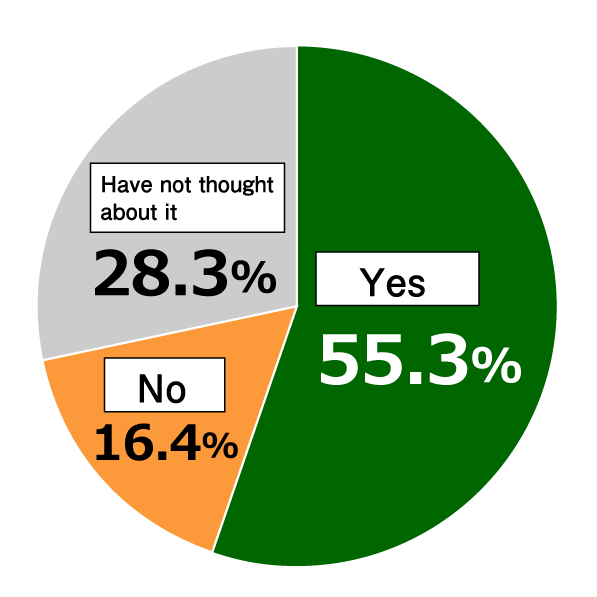
Finding: More than half (55.3%) of respondents have a field in which they want to work. (n = 1,000)
Have you decided on a field in which you want to work?
- Yes – 55.3%
- No – 16.4%
- Have not thought about it – 28.3%
Of respondents who have a field in which they want to work, the top choices were (n = 553)
- Civil servant – 15.6%
- Company employee – 12.3%
- Information technology-related – 8.7%
- Engineer – 8.3%
- Teacher – 7.1%
- Nurse – 6.1%
- Researcher – 5.8%
- Designer – 5.4%
- Entertainer – 4.2%
- Kindergarten/Day care – 3.6%
Finding: Roughly half (50.6%) of respondents want to work in a city in Japan (n = 1,000)
- Where do you want to work?
- Major city in Japan – 26.2%
- Regional city in Japan – 24.4%
- In Japan, outside a city – 3.7%
- Overseas – 4.5%
- No preference – 25.6%
- Don’t know – 15.6%
Do you intend to give priority to your private life or work? (n = 1,000)
- Private life – 54.3%
- Work – 19.8%
- Don’t know – 25.9%
What style of work do you want? (n = 1,000)
- Flexible time and place – 30.0%
- Designated time in an office or other designated place – 27.2%
- No preference – 23.2%
- Don’t know – 19.6%
Do you want to spend your entire career with the same company? (n = 1,000)
- Yes – 35.4%
- No – 23.5%
- Don’t know – 41.1%
Contact
Public Relations Team
The Nippon Foundation
- Email: cc@ps.nippon-foundation.or.jp
