Awareness Survey of 18-Year-OldsResults of 21st and 22nd installments announced
The 21st installment of the Awareness Survey of 18-Year-Olds, launched by The Nippon Foundation in October 2018, was carried out in December 2019 at the time of the UN Climate Change Conference in Madrid (COP25), on the theme of “Climate Change.” The survey showed that more than 60% of respondents believed the rise in carbon dioxide omissions is due to human activity, while fewer than 10 % believed it is part of a natural cycle. When asked if Japan, asthe world’s No. 5 carbon dioxide emitter, should reduce its omissions, roughly two-thirds replied “yes,” while roughly 13% believed Japan’s emissions are unavoidable for social activity.
The 22nd installment was carried out in mid-January 2020 on the theme of “Food Loss.” The survey showed that close to 30% or respondents leave food uneaten for reasons including “the portion was too large” and “it was something I don’t like.” In addition, roughly 85% of respondents knew the difference between the labels “use by” (generally used for fresh foods) and “best by” (generally used for processed foods), with roughly two-thirds replying that they would still eat food for which the “best by” date had expired.
Notes:
- From the 13th survey, the number of respondents, comprising men and women aged 17 to 19, has been increased to 1,000 from 800.
- In the information below, differences between total amounts and simple sums are due to rounding.
Survey 21. Climate Change (Results announced on January 31, 2020)
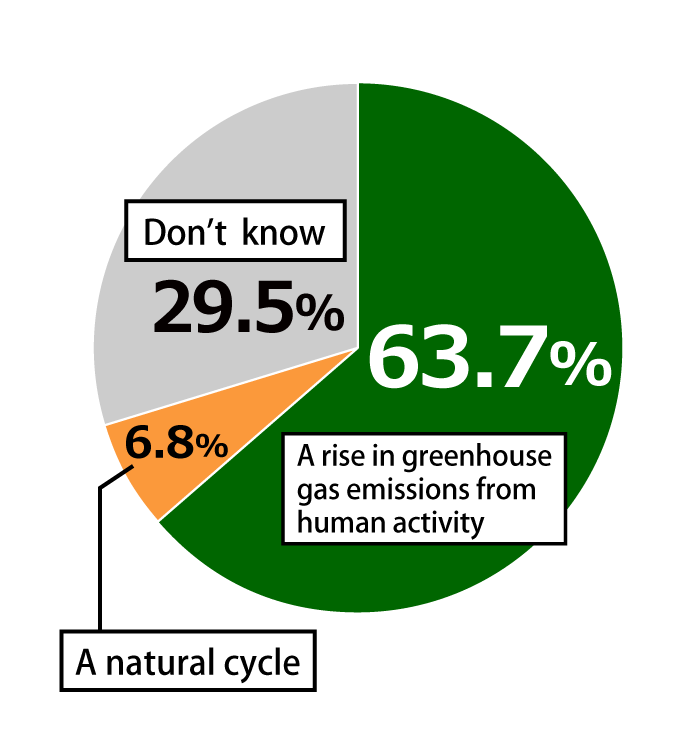
Finding: More than 60% of respondents believed that human activity is the primary cause of climate change including rising sea levels and global warming. (n=1,000)
“What do you consider to be the main cause of global warming?”
- A rise in greenhouse gas emissions from human activity – 63.7%
- A natural cycle – 6.8%
- Don’t know – 29.5%
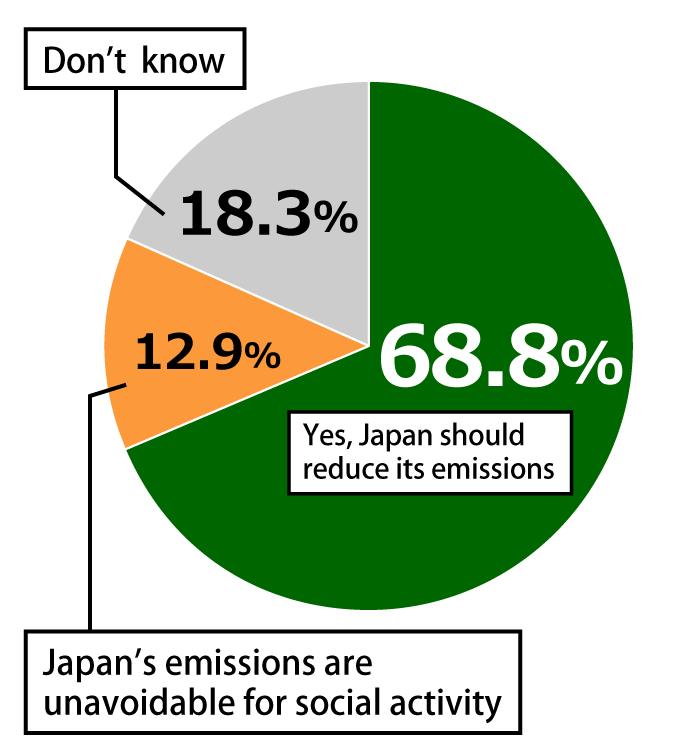
Finding: As the world’s 5th largest source of carbon dioxide emissions, roughly two-thirds of respondents felt that Japan should reduce its emissions. (n=1,000)
“As the world’s 5th largest source of carbon dioxide emissions, should Japan reduce its emissions?”
- Yes, Japan should reduce its emissions – 68.8%
- Japan’s emissions are unavoidable for social activity – 12.9%
- Don’t know – 18.3%
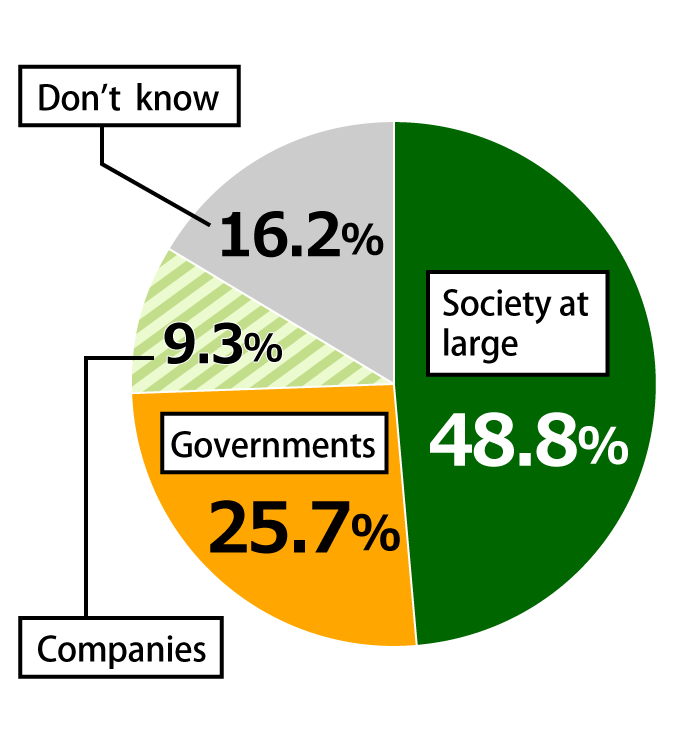
Finding: Roughly half of respondents felt that “society at large” should be the main driver of policies to address climate change. (n=1,000)
“Who do you think should be the main driver of policies to address climate change?”
- Society at large – 48.8%
- Governments – 25.7%
- Companies – 9.3%
- Don’t know – 16.2%
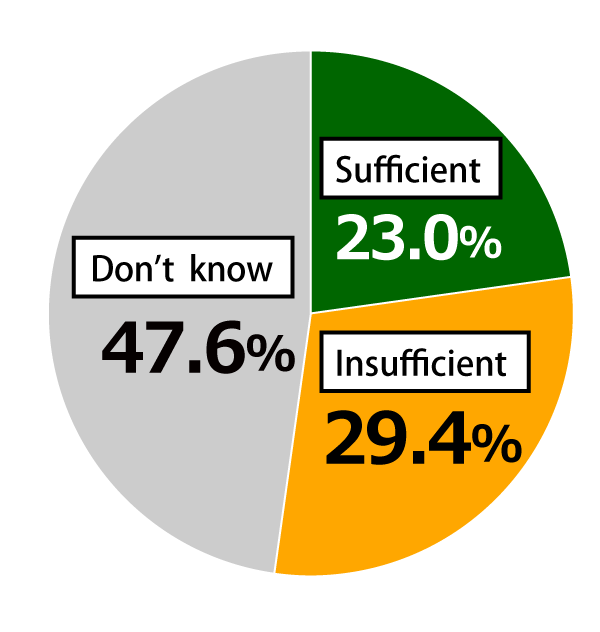
Finding: Roughly 30% of respondents felt that Japan’s targets set under the Paris Agreement are “insufficient” relative to other countries? (n=1,000)
“Are Japan’s targets under the Paris Agreement sufficient relative to other countries’ targets?”
- Sufficient – 23.0%
- Insufficient – 29.4%
- Don’t know – 47.6%
| Country | Reduction vs. 1990 |
Reduction vs. 2005 |
Reduction vs. 2013 |
|---|---|---|---|
| Japan | 18.0% | 25.4% | 26.0% (by 2030) |
| United States | 14 – 16% | 26 – 28% (by 2025) | 18 – 21% |
| EU | 40% (by 2030) | 35% | 24% |
| China | Lower the carbon intensity of GDP by 60% to 65% below 2005 levels by 2030 Peak CO2 emissions by 2030 |
||
Survey 22. Food Loss (Results announced on February 28, 2020)
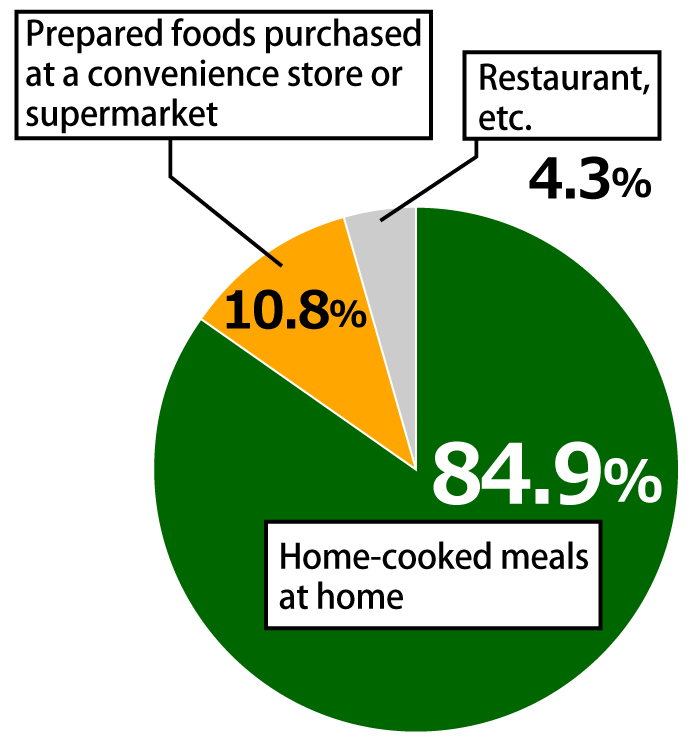
Finding: Roughly 85% of respondents primarily eat home-cooked meals at home. (n=1,000)
“What kind of food do you primarily have for meals?”
- Home-cooked meals at home – 84.9%
- Prepared foods purchased at a convenience store or supermarket – 10.8%
- Restaurant, etc. – 4.3%
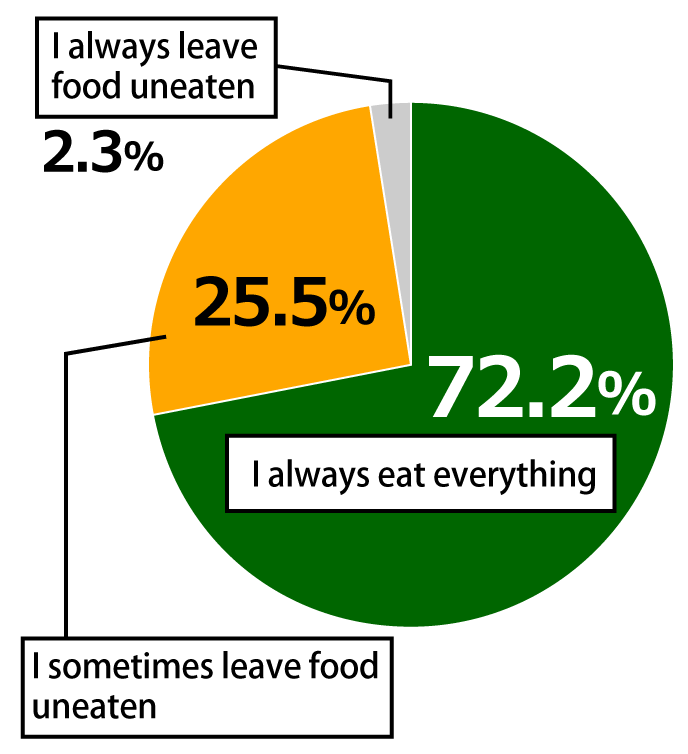
Finding: More than 70% of respondents always eat all of their food without leaving food uneaten. (n=1,000)
“Do you eat all of the food served in your meals?”
- I always eat everything – 72.2%
- I sometimes leave food uneaten – 25.5%
- I always leave food uneaten – 2.3%
Of those respondents who sometimes or always leave food uneaten (n=278), the top reasons for doing so were:
- The portion was too large – 54.7%
- It was something I don’t like – 20.9%
- I didn’t like the taste – 10.8%
- I didn’t have time to eat everything – 2.9%
- I’m on a diet – 2.9%
- I thought it wouldn’t matter – 1.4%
- No particular reason – 6.5%
Finding: More than 80% of respondents know the difference between a food product’s “use by” date and “best by” date, and more than 60% would still eat food for which the “best by” date had expired. (n = 1,000)
“Do you know the difference between a food product’s “use by” date and “best by” date?”
- Yes – 85.3%
- No – 14.7%
Note: “Use by” is used for fresh, perishable foods for which eating after this date could cause illness. “Best by” is for processed foods that may change flavor or lose nutritional value after this date, but eating them will not make a person ill.
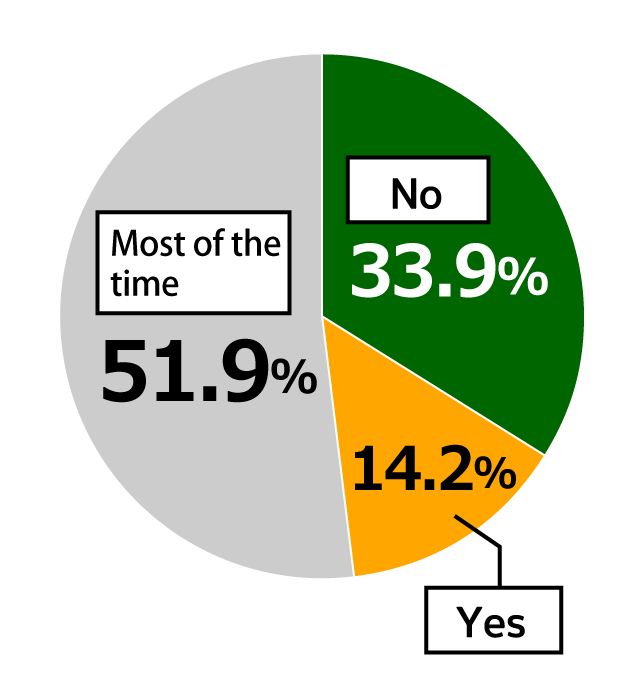
Finding: Of all respondents, roughly two-thirds would generally still eat food after its “best by” date. (n = 1,000)
“Would you be still eat food after its “best by” date?”
- No – 33.9%
- Yes – 14.2%
- Most of the time – 51.9%
In response to the question, “What measures should be taken to reduce food loss?”, the top replies were “Discount the price as the ‘use by’ or ‘best by’ date nears” and “Change the thinking of food suppliers and consumers.” (multiple answers allowed; n = 1,000)
“What measures should be taken to reduce food loss?”
- Discount the price as the “use by” or “best by” date nears – 54.8%
- Change the thinking of food suppliers and consumers – 54.5%
- Donate the item to a food bank – 40.9%
- Improve the distribution network including relaxing “use by” and “best by” dates – 22.5%
- Fine companies that throw away large quantities of food – 19.5%
- Others – 2.8%
- Nothing in particular – 16.0%
Contact
Public Relations Team
The Nippon Foundation
- Email: cc@ps.nippon-foundation.or.jp
