Awareness Survey of 18-Year-OldsResults of 28th installment announced
The 28th installment of the Awareness Survey of 18-Year-Olds, launched by The Nippon Foundation in October 2018, was carried out in late June on the theme of “Social Media.” The survey showed that more than 90% of respondents use social media, and of those respondents, roughly 60% used social media at least two hours every day. Of social media users, 75% described social media as “indispensable” and 44% said they “relied” on social media, while roughly 1 in 20 replied that they had posted unsubstantiated criticism or insults.
Notes:
- From the 13th survey, the number of respondents, comprising men and women aged 17 to 19, has been increased to 1,000 from 800. (With the exception of the 20th installment, “Awareness Survey of Society and Country,” all surveys cover respondents in Japan only.)
- In the information below, differences between total amounts and simple sums are due to rounding.
Survey 28. Social Media (Results announced on July 30, 2020)
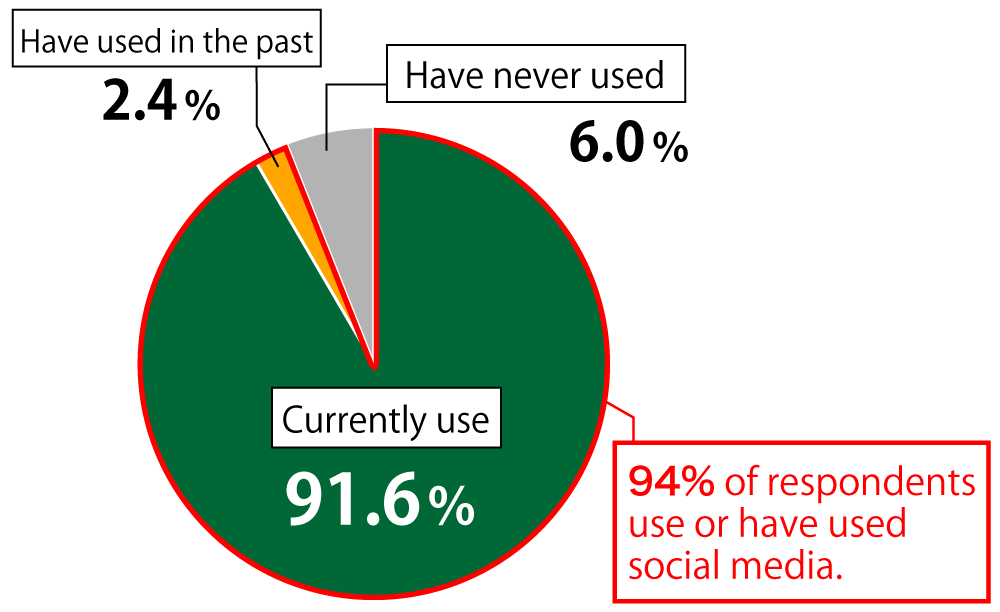
Finding: 94% of respondents use or have used social media. (n = 1,000)
“Do you normally use social media?”
- Currently use – 91.6%
- Have used in the past – 2.4%
- Have never used – 6.0%
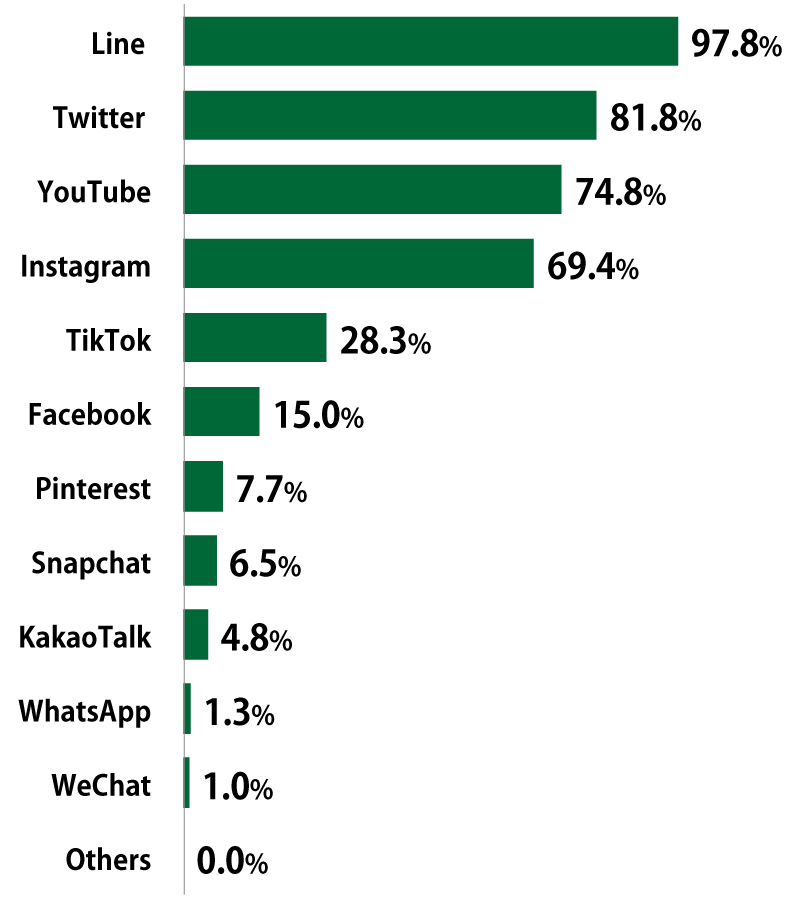
Finding: Of those respondents who use or have used social media, Line is the most popular, followed by Twitter, YouTube, and Instagram. (multiple answers allowed; n = 940)
“What social media do you use?”
- Line – 97.8%
- Twitter – 81.8%
- YouTube – 74.8%
- Instagram – 69.4%
- TikTok – 28.3%
- Facebook – 15.0%
- Pinterest – 7.7%
- Snapchat – 6.5%
- KakaoTalk – 4.8%
- WhatsApp – 1.3%
- WeChat – 1.0%
- Others – 0.0%
Finding: “Information gathering” is the most popular use of social media, followed by “Communicating with friends” and “Communicating for school or work.” (multiple answers allowed; n = 940)
“For what do you use social media?”
- Information gathering – 80.4%
- Communicating with friends – 75.5%
- Communication for school or work – 69.0%
- Disseminating information – 40.1%
- Games – 29.0%
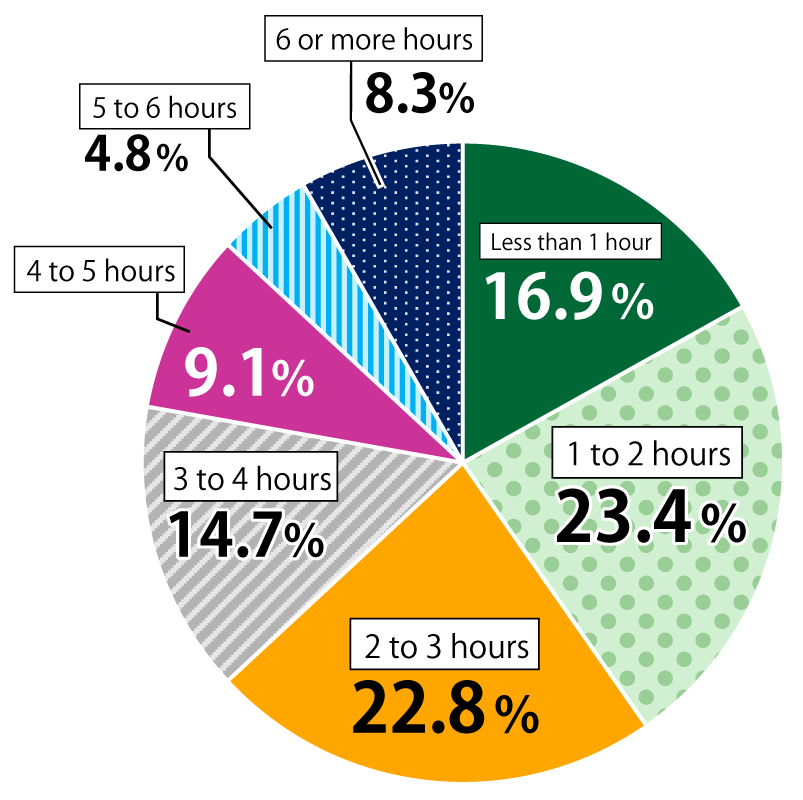
Finding: Close to half of social media users use social media for one to three hours per day. (n = 940)
“For roughly how many hours per day do you use social media?”
- Less than 1 hour – 16.9%
- 1 to 2 hours – 23.4%
- 2 to 3 hours – 22.8%
- 3 to 4 hours – 14.7%
- 4 to 5 hours – 9.1%
- 5 to 6 hours – 4.8%
- 6 or more hours – 8.3%
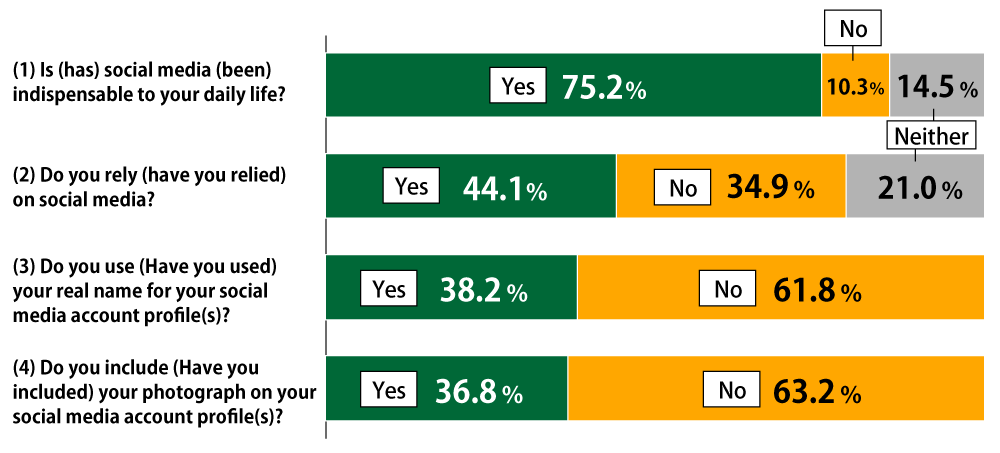
Finding: Three-fourths of social media users consider social media to be indispensable to their daily lives, while close to half rely on social media. (n = 940)
Questions regarding use of social media
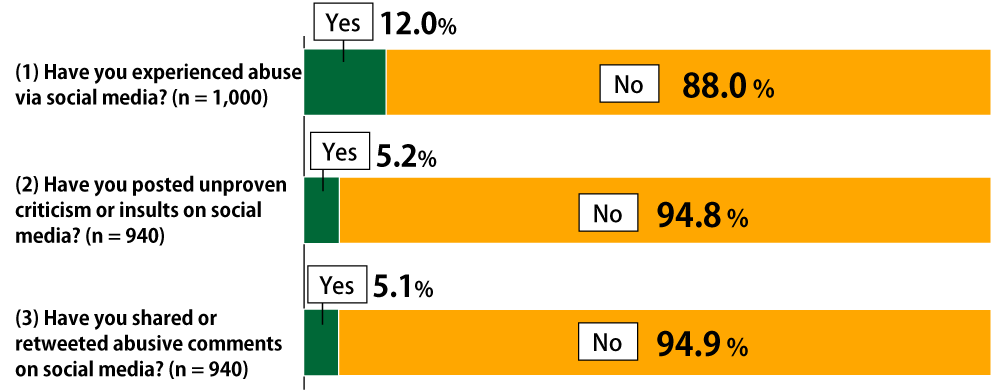
Findings: 12% of respondents have experienced abuse via social media, while roughly 5% of social media users have posted unproven criticism or insults on social media, and roughly 5% have shared or retweeted abusive comments.
Questions regarding potentially harmful use of social media
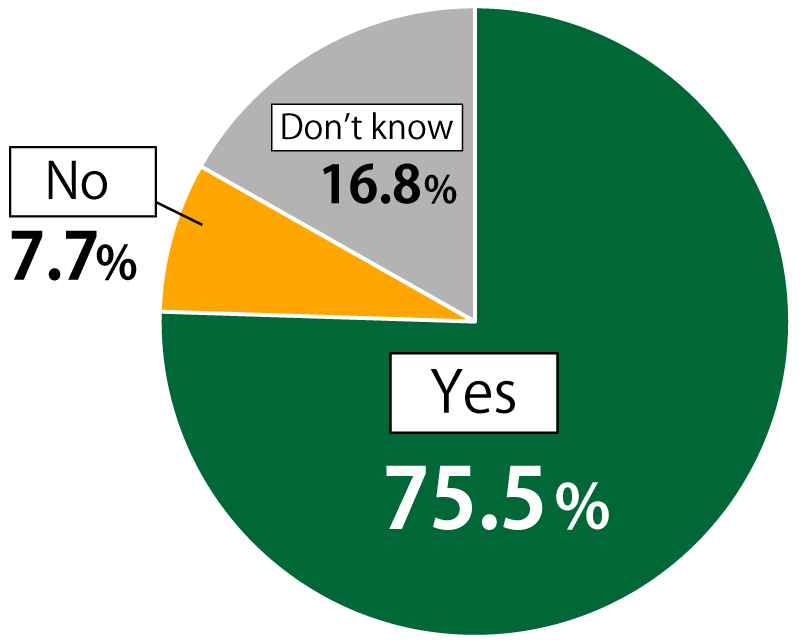
Finding: Three-fourths of respondents believe social media should be legally regulated to protect people from things like slander and misinformation. (n = 1,000)
“Do you believe social media should be legally regulated to protect people from things like slander and misinformation?”
- Yes – 75.5%
- No – 7.7%
- Don’t know – 16.8%
Of respondents who believed that legal regulation was necessary, the main reasons given were: (multiple answers allowed; n = 755)
- To protect people from slander, harmful rumors, and misinformation – 64.1%
- Slander and defamation on social media are rampant – 61.7%
- Illegal postings need to be restricted – 40.4%
- Stricter laws will prevent slander and defamation – 39.2%
- There is no clear definition of illegal postings – 35.6%
Of respondents who believed that legal regulation was not necessary, the main reasons given were: (multiple answers allowed; n = 77)
- It would create problems of individual awareness – 49.4%
- Freedom of speech should be protected absolutely – 33.8%
- It would create concerns of the government controlling information – 27.3%
- It could infringe on people’s privacy – 24.7%
- Confidential telecommunications should be protected – 24.7%
Of all respondents, the main points that they believed should be addressed in legal regulation were: (multiple answers allowed; n = 1,000)
- Stricter penalties for persons posting slander and defamation – 59.2%
- Expedited procedures for disclosing information about persons posting messages – 52.2%
- A clear definition of what constitutes an illegal post – 38.1%
- Laws for the swift removal of illegal posts – 35.2%
- Extension of the period for retaining information that can identify persons posting comments – 34.7%
- Extension of the statute of limitation for defamation – 24.7%
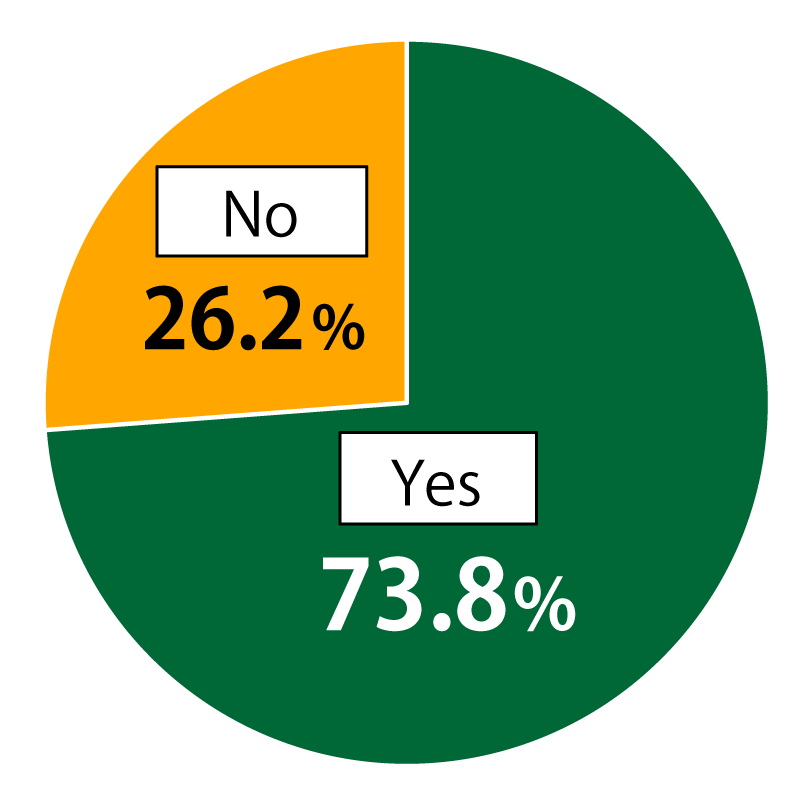
Finding: Close to three-fourths of respondents have studied internet literacy. (n = 1,000)
“Have you studied internet literacy?”
- Yes – 73.8%
- No – 26.2%
Of respondents who had studied internet literacy, the places where they studied were: (multiple answers allowed; n = 738)
- Classes at school – 95.5%
- On their own – 15.4%
- At home – 5.1%
- Websites provided by social media companies – 2.6%
- With friends – 1.8%
- Other – 0.3%
Of all respondents, the places where they thought net literacy should be taught were: (single answer; n = 1,000)
- Classes at school – 69.6%
- On one’s own – 11.7%
- At home – 8.3%
- Social media companies – 7.5%
- Government-provided self-instruction – 2.3%
- Other – 0.6%
Contact
Public Relations Team
The Nippon Foundation
- Email: cc@ps.nippon-foundation.or.jp
