Awareness Survey of 18-Year-OldsResults of 19th and 20th installments announced

The 19th installment of the Awareness Survey of 18-Year-Olds, launched by The Nippon Foundation in October 2018, was carried out in mid-September on the theme of “Media.” The survey showed that the information deemed most important for daily life was weather and disaster-related information, followed closely by entertainment and music, and then government, economic, and society. Television was the most popular source of information, followed by social media, news websites, video distribution and sharing sites, and friends and family. More than 80% of respondents have felt that information available on the internet is false, and more than 65% have confirmed the accuracy of information they saw on social media.

The 20th installment was an “Awareness Survey of Society and Country,” and for this installment the survey covered 17- to 19-year-olds in nine countries: China, Germany, India, Indonesia, Japan, South Korea, the United Kingdom, the United States, and Vietnam, with the results announced on November 30 at The Nippon Foundation Social Innovation Forum 2019. The survey showed that in a number of areas, young people in Japan ranked last compared with their peers in other countries in terms of considering themselves to be adults, having dreams for the future, and believing that they can change society or their country.

Notes:

  1. From the 13th survey, the number of respondents, comprising men and women aged 17 to 19, has been increased to 1,000 from 800.
  2. In the information below, differences between total amounts and simple sums are due to rounding.

Survey 19. Media (Results announced on October 29, 2019)

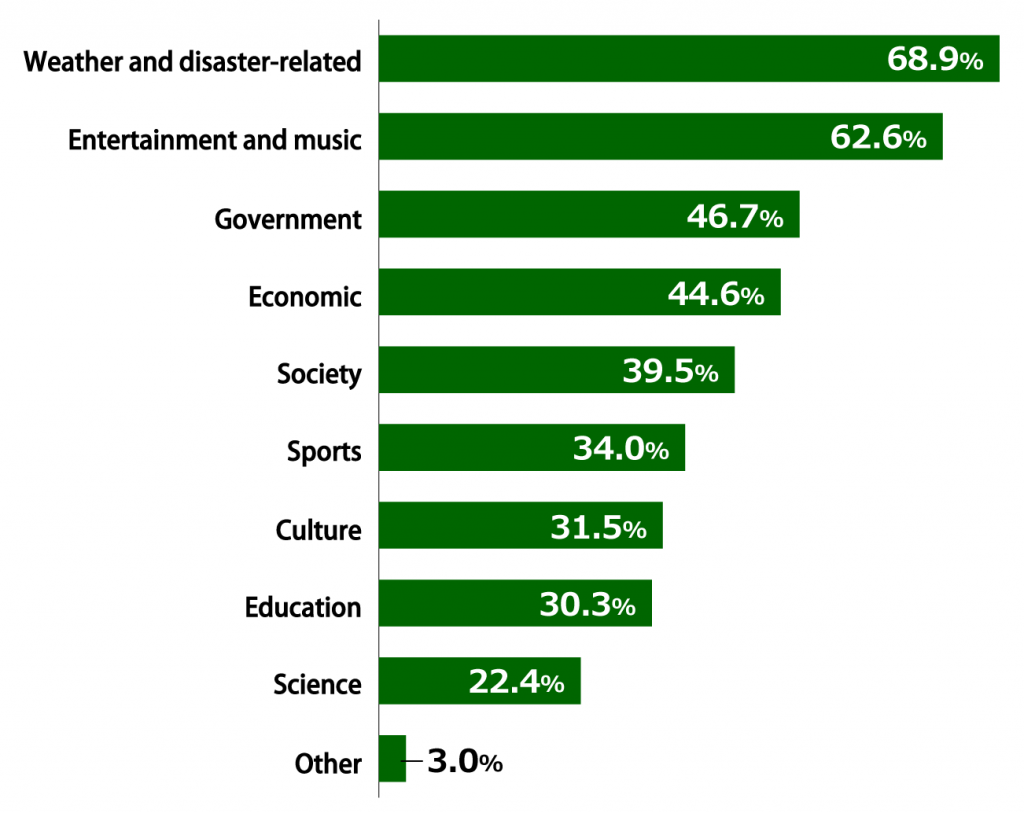
Finding: More than 60% of respondents felt they need weather and disaster-related information, as well as information about entertainment and music, in their daily lives, followed by information regarding government, the economy, and society. (multiple answers allowed; n=1,000)

“What kinds of information do you need in your daily life?”

Bar chart showing results from Awareness Survey of 18-Year-Olds: In response to the question, “What kinds of information do you need in your daily life?” (multiple answers allowed; n = 1,000), 68.9% of respondents replied “Weather and disaster-related,” 62.6% replied “Entertainment and music,” 46.7% replied “Government,” 44.6% replied “Economic,” 39.5% replied “Society,” 34.0% replied “Sports,” 31.5% replied “Culture,” 30.3% replied “Education,” 22.4% replied “Science,” and 3.0% replied “Other.”

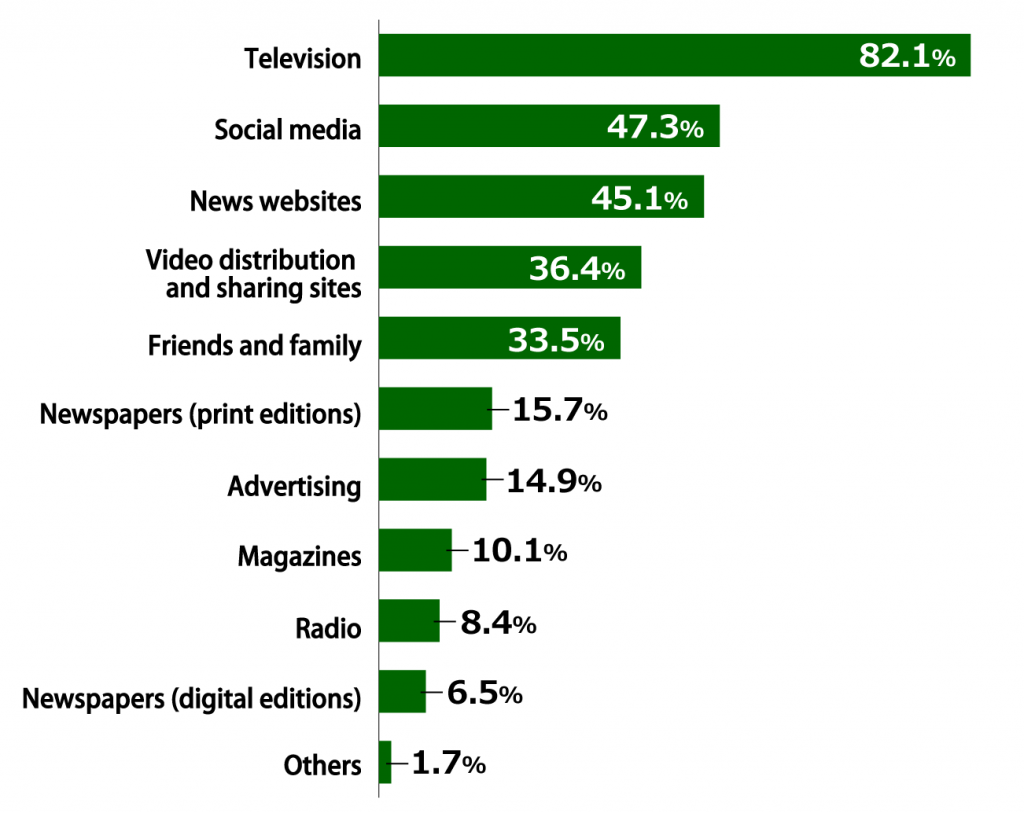
Finding: At more than 80%, television was overwhelmingly identified as a source of information, followed by social media and news websites. (multiple answers allowed; n=1,000)

“Where do you seek the information that you need in your daily life?”

Bar chart showing results from Awareness Survey of 18-Year-Olds: In response to the question, “Where do you seek the information that you need in your daily life?” (multiple answers allowed; n = 1,000), 82.1% of respondents replied “Television,” 47.3% replied “Social media,” 45.1% replied “News websites,” 36.4% replied “Video distribution and sharing sites,” 33.5% replied “Friends and family,” 15.7% replied “Newspapers (print editions),” 14.9% replied “Advertising,” 10.1% replied “Magazines,” 8.4% replied “Radio,” 6.5% replied “Newspapers (digital editions),” and 1.7% replied “Others.”

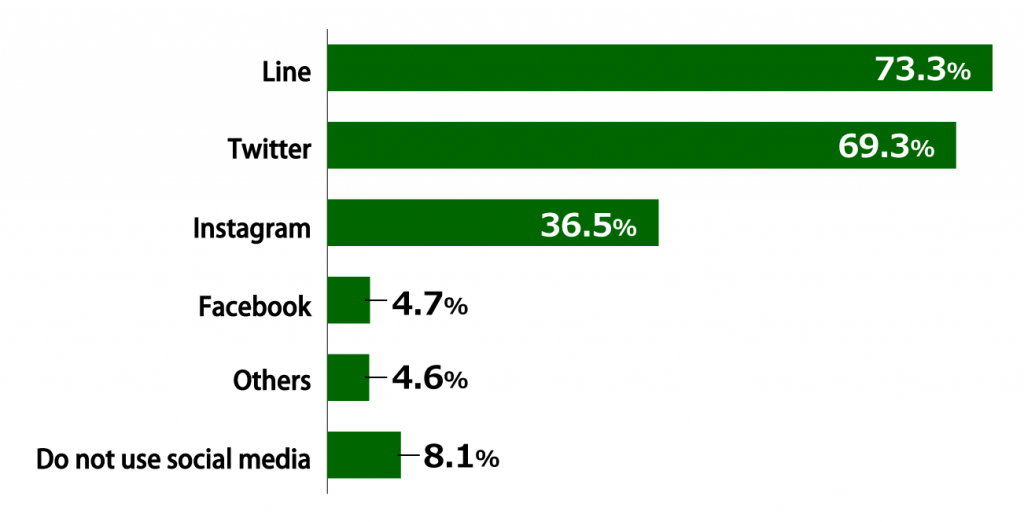
Finding: Line and Twitter are the most popular social media platforms. (multiple answers allowed; n=1,000)

“Which social media do you use for news and other information?”

Bar chart showing results from Awareness Survey of 18-Year-Olds: In response to the question, “Which social media do you use for news and other information?” (multiple answers allowed; n = 1,000), 73.3% or respondents replied “Line,” 69.3% replied “Twitter,” 36.5% replied “Instagram,” 4.7% replied “Facebook, “4.6% replied “Others,” and 8.1% replied that they do not use social media.

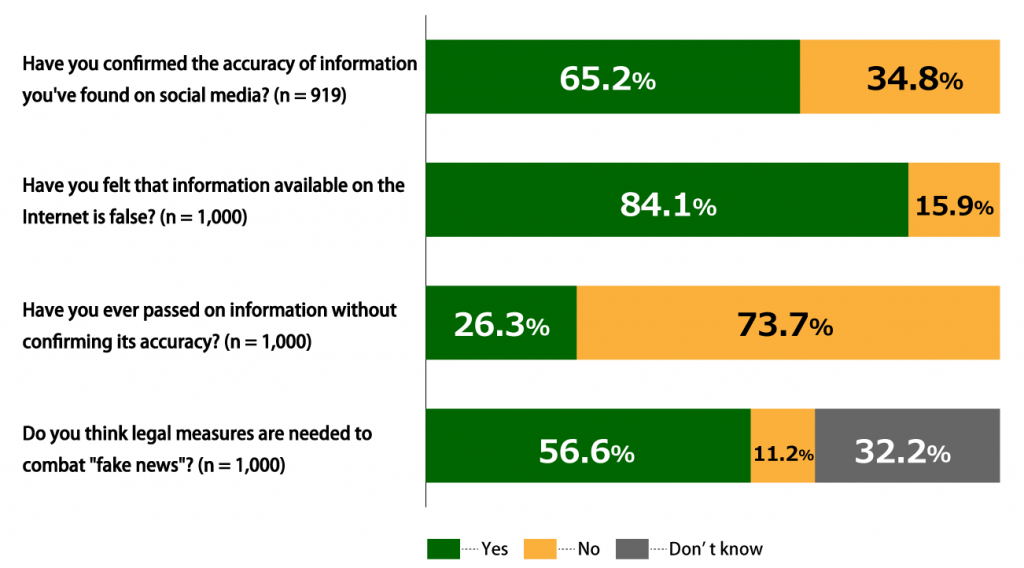
Other Findings (n=1,000)

The survey also found that 65.2% of respondents have confirmed the accuracy of information they have found on social media, 84.1% have felt that information available on the internet is false, 26.3% have passed on information without confirming its accuracy, and 56.6% believe that legal measures are needed to combat “fake news.”

Bar chart showing results from Awareness Survey of 18-Year-Olds: In response to the question, “Have you confirmed the accuracy of information you’ve found on social media?” (n = 919), 65.2% of respondents who use social media replied “Yes,” while 34.8% replied “No.” In response to the question “Have you felt that information available on the Internet is false?” (n = 1,000), 84.1% of respondents replied “Yes” and 15.9% replied “No.” In response to the question “Have you ever passed on information without confirming its accuracy?” (n = 1,000), 26.3% of respondents replied “Yes” while 73.7% replied “No.” In response to the question “Do you think legal measures are needed to combat "fake news"?” (n = 1,000), 56.6% of respondents replied “Yes,” while 11.2% replied “No” and 32.2% replied “Don’t know.”

Survey 20. Nine-country survey on “Society and Country (Results announced on November 30, 2019)

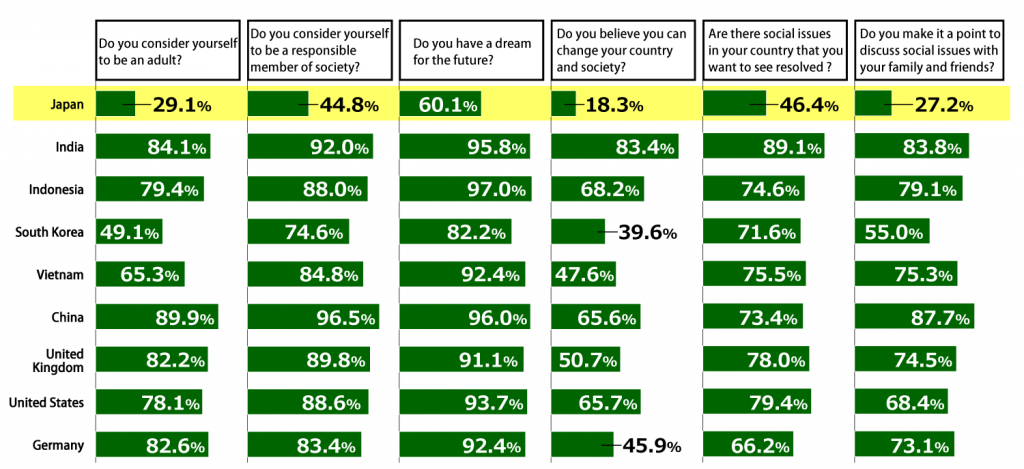
Finding: Japanese respondents were less likely than respondents in other countries to view themselves as responsible adults engaged in society. (n=1,000 per country – China, Germany, India, Indonesia, Japan, South Korea, the United Kingdom, the United States, and Vietnam)

Responses to questions related to how respondents in nine countries viewed themselves (percentage replying “Yes”).

Bar charts showing results of questions from Awareness Survey of 18-Year-Olds related to how respondents in nine countries viewed themselves, expressed as the percentage of respondents replying “Yes.” (n=1,000 per country – Japan, India, Indonesia, South Korea, Vietnam, China, the United Kingdom, the United States, and Germany,)
Question 1: Do you consider yourself to be an adult? Japan – 29.1%, India – 84.1%, Indonesia – 79.4%, South Korea – 49.1%, Vietnam – 65.3%, China – 89.9%, United Kingdom – 82.2%, United States – 78.1%, Germany – 82.6%. Question 2: Do you consider yourself to be a responsible member of society? Japan – 44.8%, India – 92.0%, Indonesia – 88.0%, South Korea – 74.6%, Vietnam – 84.8%, China – 96.5%, United Kingdom – 89.8%, United States – 88.6%, Germany – 83.4%. Question 3: Do you have a dream for the future? Japan – 60.1%, India – 95.8%, Indonesia – 97.0%, South Korea – 82.2%, Vietnam – 92.4%, China – 96.0%, United Kingdom – 91.1%, United States – 93.7%, Germany – 92.4%. Question 4: Do you believe you can change your country and society? Japan – 18.3%, India – 83.4%, Indonesia – 68.2%, South Korea – 39.6%, Vietnam – 47.6%, China – 65.6%, United Kingdom – 50.7%, United States – 65.7%, Germany – 45.9%. Question 5: Are there social issues in your country that you want to see resolved? Japan – 46.4%, India – 89.1%, Indonesia – 74.6%, South Korea – 71.6%, Vietnam – 75.5%, China – 73.4%, United Kingdom – 78.0%, United States – 79.4%, Germany – 66.2%. Question 6: Do you make it a point to discuss social issues with your family and friends? Japan – 27.2%, India – 83.8%, Indonesia – 79.1%, South Korea – 55.0%, Vietnam – 75.3%, China – 87.7%, United Kingdom – 74.5%, United States – 68.4%, Germany – 73.1%.

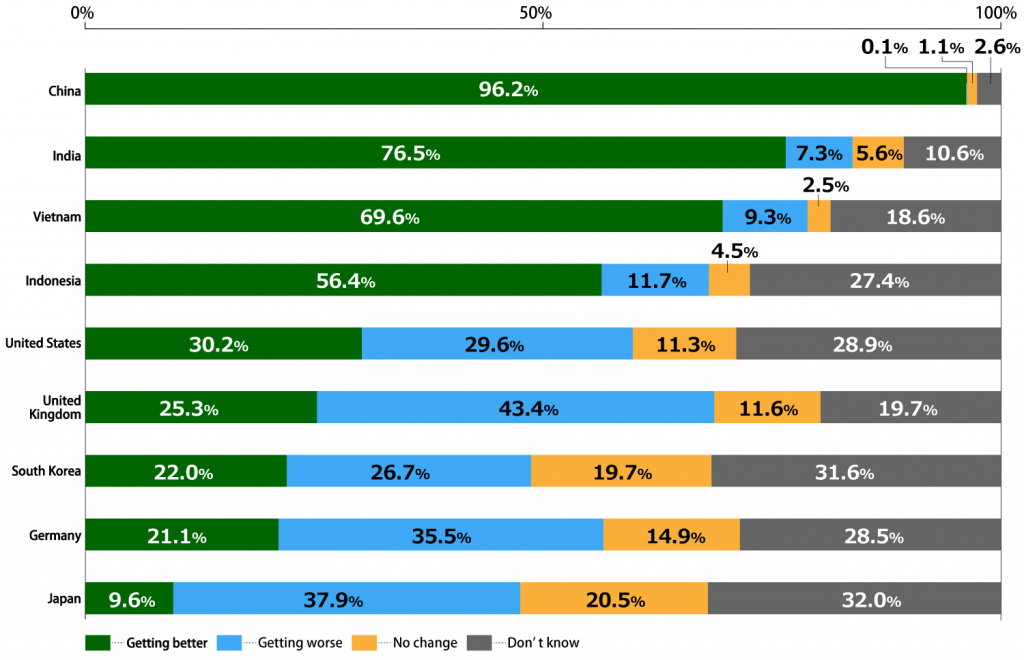
Finding: Japanese respondents were less likely than respondents in other countries to be optimistic about their country’s future. (n=1,000 per country – China, Germany, India, Indonesia, Japan, South Korea, the United Kingdom, the United States, and Vietnam)

“How do you view your country’s future?”

Bar chart showing results from Awareness Survey of 18-Year-Olds: In response to the question “How do you view your country’s future?” the breakdown in responses by country was. (n=1,000 per country – China, India, Vietnam, Indonesia, the United States, the United Kingdom, South Korea, Germany, and Japan) China: Getting better – 96.2%; Getting worse – 0.1%; No change – 1.1%; Don’t know – 2.6%. India: Getting better – 76.5%; Getting worse – 7.3%; No change – 5.6%; Don’t know – 10.6%. Vietnam: Getting better – 69.6%; Getting worse – 9.3%; No change – 2.5%; Don’t know – 18.6%. Indonesia: Getting better – 56.4%; Getting worse – 11.7%; No change – 4.5%; Don’t know – 27.4%. United States: Getting better – 30.2%; Getting worse – 29.6%; No change – 11.3%; Don’t know – 28.9%. United Kingdom: Getting better – 25.3%; Getting worse – 43.4%; No change – 11.6%; Don’t know – 19.7%. South Korea: Getting better – 22.0%; Getting worse – 26.7%; No change – 19.7%; Don’t know – 31.6%. Germany: Getting better – 21.1%; Getting worse – 35.5%; No change – 14.9%; Don’t know – 28.5%. Japan: Getting better – 9.6%; Getting worse – 37.9%; No change – 20.5%; Don’t know – 32.0%.

Please refer to the following article for an analysis and opinions regarding the results of this survey presented at The Nippon Foundation Social Innovation Forum 2019:

Contact

Public Relations Team
The Nippon Foundation

  • Email: cc@ps.nippon-foundation.or.jp